Raspberry Pi 5 Monitoring with Grafana & Prometheus
Overview
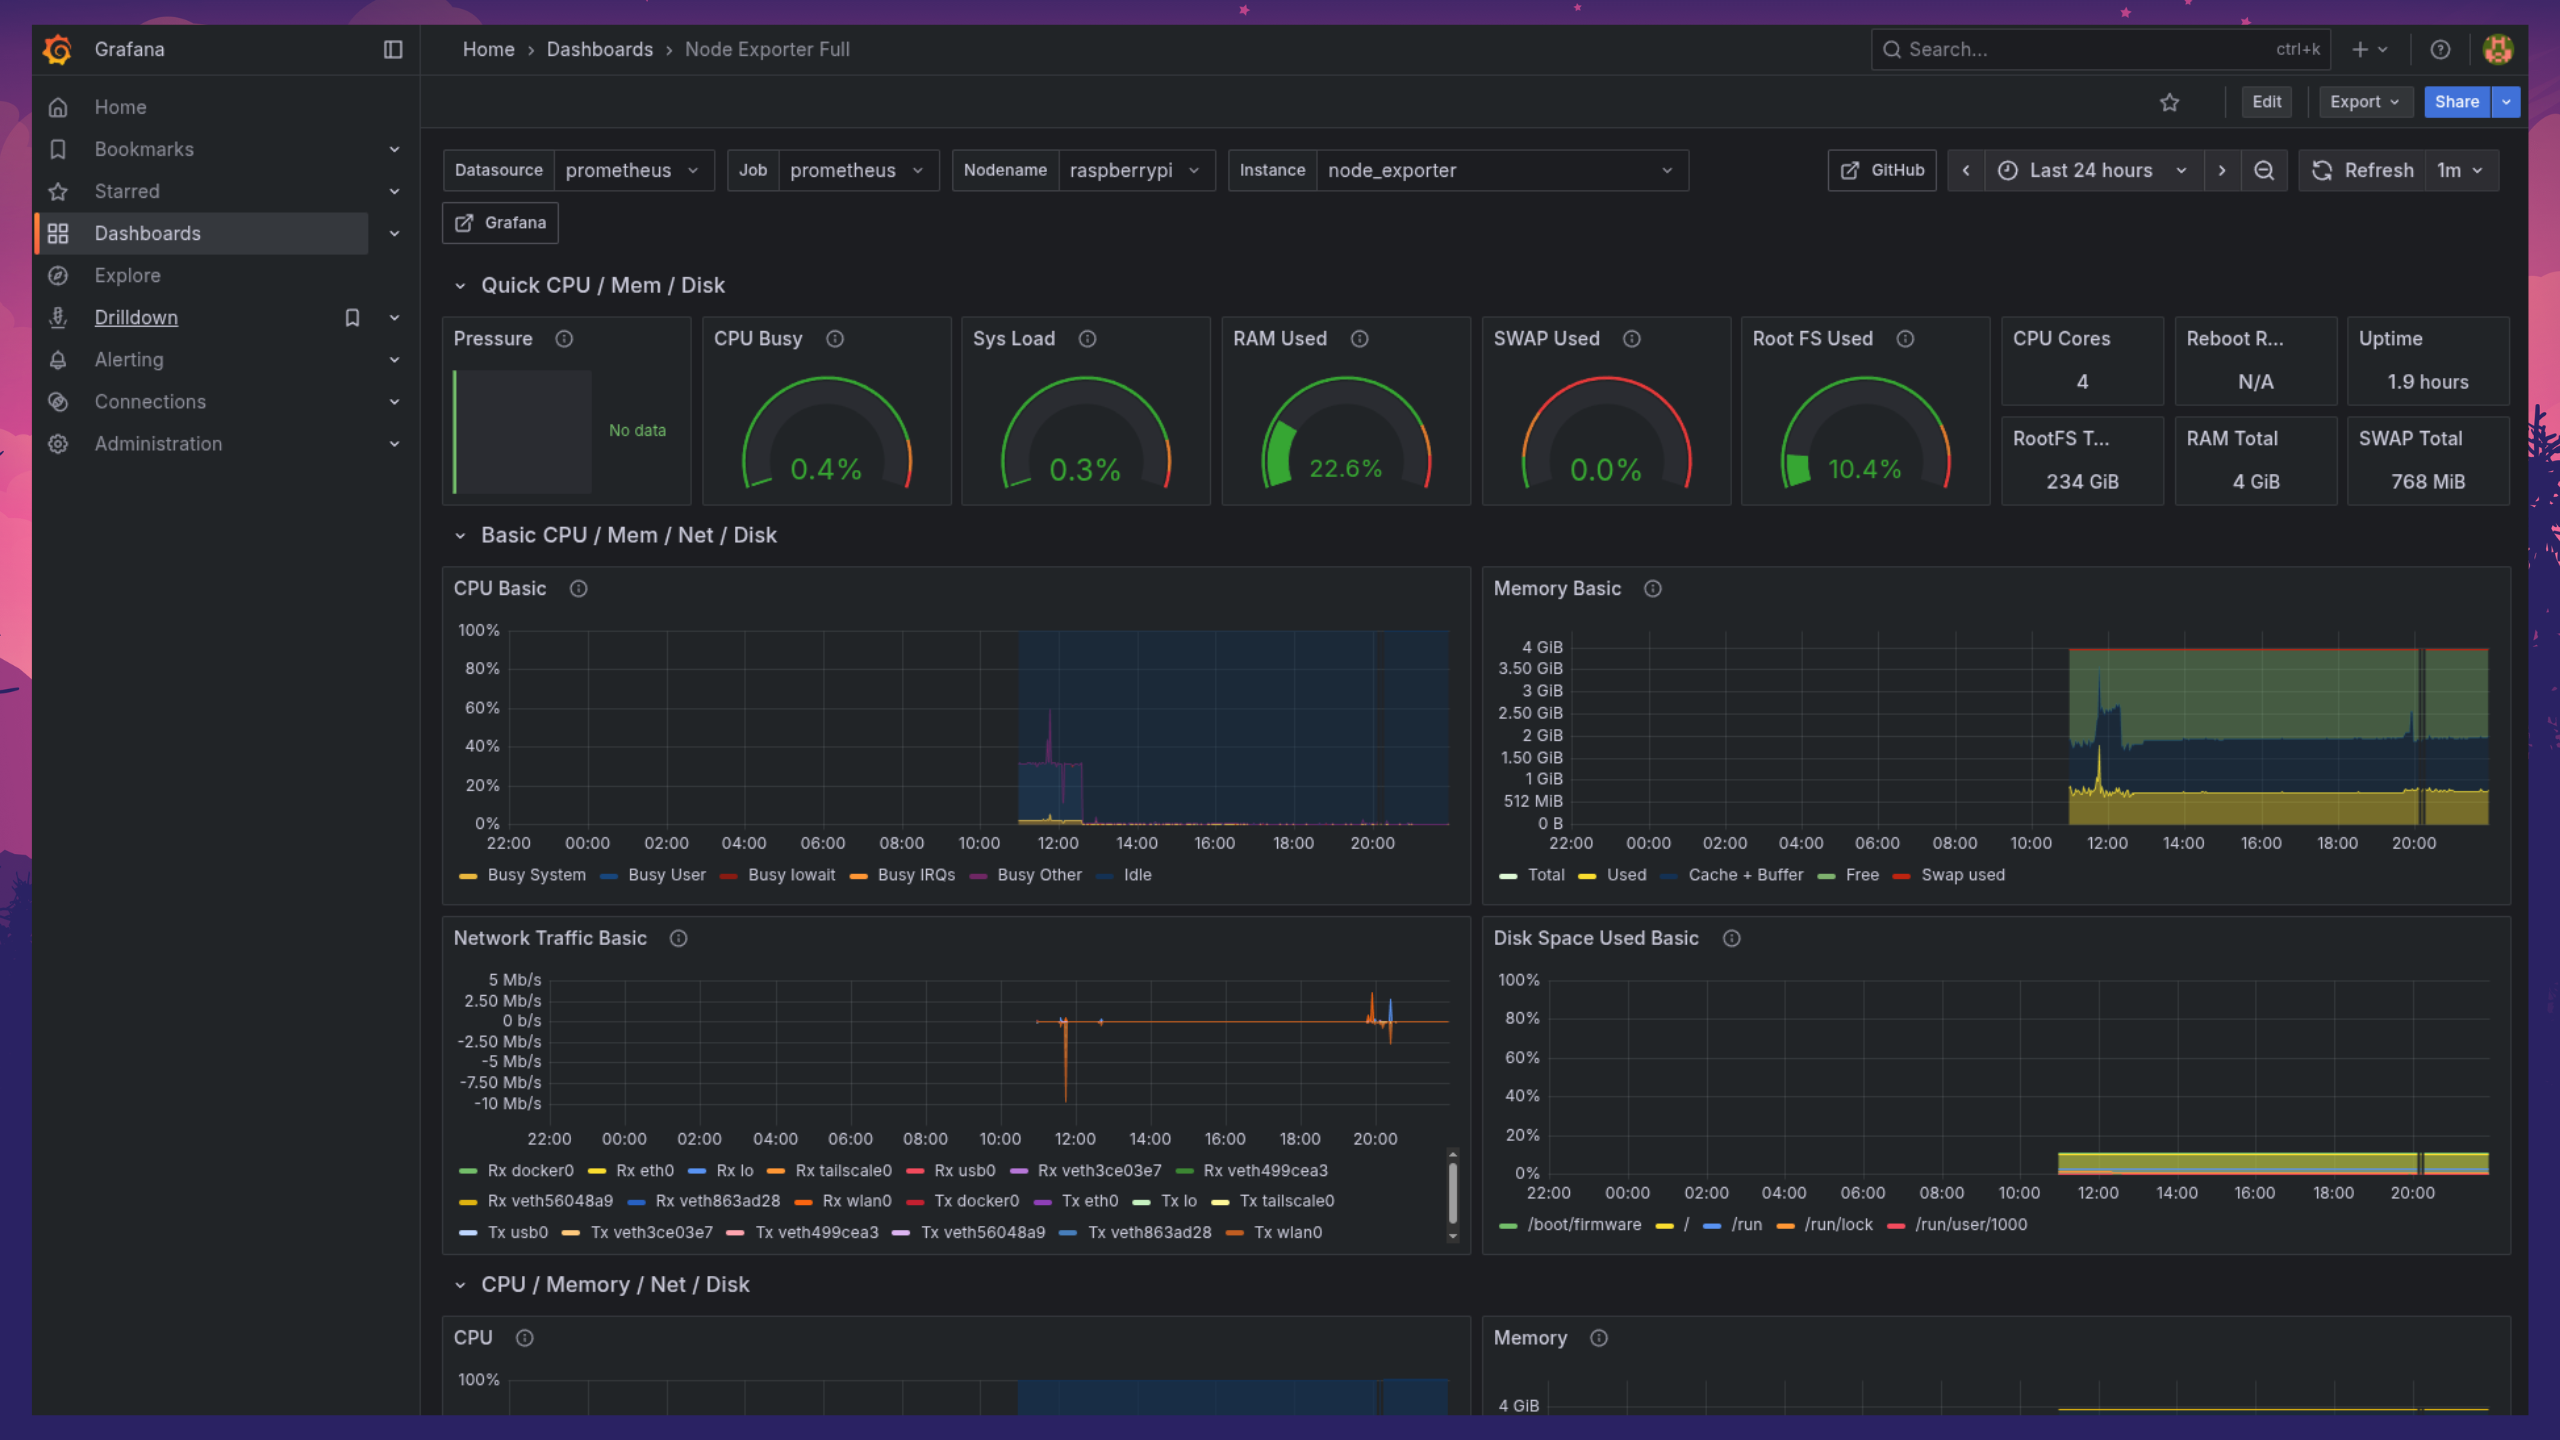
Instead of flying blind on what my Raspberry Pi 5 is actually doing, I set up a full observability stack using Grafana, Prometheus, and Node Exporter. Real-time dashboards show CPU, memory, disk, and network metrics, all accessible remotely through a Cloudflare Tunnel without exposing a single local port.
Setup Summary
Configuration Details
Prometheus Installation & Metrics Collection
Installed Prometheus on the Raspberry Pi to collect system metrics including CPU usage, memory consumption, disk I/O, and network statistics. Prometheus serves as the backend data source for all Grafana dashboards.
Node Exporter Integration
Integrated Node Exporter to gather detailed system information from the Raspberry Pi. Metrics from Node Exporter complement Prometheus data, providing a consolidated view of system health and performance.
Grafana Setup
Hosted Grafana locally on the Raspberry Pi. Connected it to Prometheus and Node Exporter as data sources, creating custom dashboards to visualize CPU, memory, disk, network usage, and overall device health.
Cloudflare Tunnel Integration
Configured Cloudflare Tunnel to securely expose Grafana dashboards without opening local ports. Encrypted, authenticated remote access while keeping the Raspberry Pi completely protected from direct exposure.
Performance & Logging
Dashboards update in real-time, enabling monitoring of multiple metrics simultaneously. Prometheus scraping intervals and retention policies are configured for efficient resource usage on limited hardware.
Alerting & Email Notifications
Configured Grafana's built-in alerting system to monitor RAM and CPU thresholds. When usage exceeds defined limits, Grafana automatically sends email notifications, providing proactive alerts without needing to actively watch the dashboard.
Benefits
Real-time monitoring of CPU, memory, disk, and network metrics
Custom Grafana dashboards for full system visibility
Secure remote access via Cloudflare Tunnel without exposing ports
Lightweight self-hosted solution optimized for Raspberry Pi resources
Centralized observability with Prometheus and Node Exporter integration
Proactive email alerts for RAM and CPU threshold breaches